Understanding pharmacy reimbursement trends in Oregon
On September 30, 2021, Bi-Mart, a regional retail chain in Oregon and surrounding states, announced plans to exit the pharmacy business by January 2022. Citing increased costs and ongoing reimbursement pressures, the company transitioned their pharmacy inventory and prescription files to competitor Walgreens. The move was perhaps unsurprising as just two years prior, Bi-Mart had shuttered its pharmacy services in 13 locations in the Portland area. Predictable or not, the impact of the pharmacy closures was one that almost certainly was going to increase healthcare inequities in Oregon. That’s because there were rural areas in Oregon where Bi-Mart was virtually the only pharmacy accessible to their patients. By shutting their pharmacy businesses, available pharmacy options became more limited, potentially creating access issues in critical areas of the state (Oregon statute [OAR 431-121-2000] identifies a critical access pharmacy as one where there is no other pharmacy within 10 miles). As a result, the ability to get prescriptions timely, obtain needed vaccinations, receive needed healthcare screenings and monitoring, or any number of pharmacy services in the area decreased with the ceasing of pharmacy operations.
Pharmacists provide essential care to the residents of Oregon. Pharmacy staff actions were critical to getting people vaccinated against COVID-19, implementing the state’s key public safety response to the pandemic and saving lives. However, the profession of pharmacy faces challenges that have led to shorter operating hours, longer wait times for prescriptions, and less time for pharmacists to collaborate with physicians, counsel their patients, better manage chronic diseases, and address other broader health concerns. The Oregon Board of Pharmacy states that it continues to receive a high number of complaints from licensees and the public about conditions at retail pharmacy.
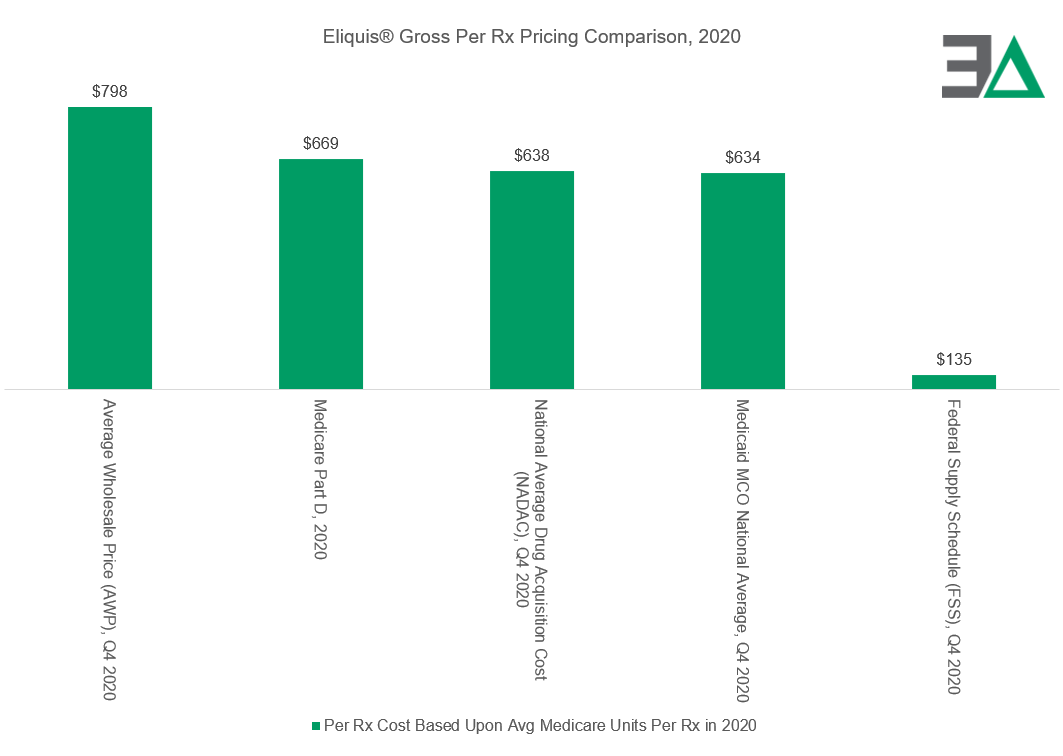
In addition to being essential healthcare providers, pharmacies are businesses. From a business perspective, we should expect that their financial incentives will have a meaningful impact on the focus of their services, as their viability will be determined by their ability to minimize losses and maximize profits. However, the desire of drug pricing policy to pay less for prescriptions is often at odds with the goals of ensuring the availability and accessibility of quality pharmacy services. This is because the primary way for the pharmacy businesses to obtain revenues is through dispensing medications. Despite prior work in the subject of prescription drug reimbursement practices, it is often forgotten that the revenues obtained from dispensing medications are highly differentiated within the market, such that some payers or purchasers of drugs incur significantly higher costs than others. For instance, Eliquis®, the drug with the highest gross Medicare expenditures in 2020, shows how a price for single-source brand product can be significantly different from program-to-program (i.e., 80% different in the reviewed gross spending in federal programs in 2020).
The disparities in pharmacy pricing and the inequity of payment resulted in 3 Axis Advisors, LLC, being commissioned by the Oregon State Pharmacy Association (OSPA) to review reimbursement trends between payers and retail pharmacies between 2019 and 2021. The primary request was to identify if there may be differential pricing in payment or spread pricing among Oregon Medicaid retail pharmacy networks, which could compromise the sustainability of some providers and create barriers to care for many Oregonians. We are pleased to release the results of this exhaustive study, which can be downloaded here.

Oregon Medicaid, like many other states, administers health benefits to beneficiaries either through a fee-for-service (FFS) arrangement, where the state pays providers directly for delivered healthcare service, or by way of managed care organizations (MCOs), in which the MCO provides care based on a capitated rate per member per month basis (also referred to as Coordinated Care Organizations (CCOs) within the Oregon Medicaid system).
In the CCO arrangement, the CCO will form its own network of providers in which payment rates may vary from FFS published rates and amongst providers.
We obtained reimbursement data between 2019 and 2021 from 86 of Oregon’s estimated 534 retail community pharmacies as of 2020 (16.1%). Our findings identified significant disparities in reimbursement between the pharmacies in our study and all pharmacy providers based on reimbursements reported to the Oregon Medicaid program as reflected in the State Drug Utilization Database (SDUD).

For example, in comparing reimbursements between the aggregate Oregon Medicaid program and our studied retail pharmacy group, there were substantial differences in both access to claims and gross margins with the CCO figures.
Our study pharmacies on average had access to 7% less of the basket of CCO claims (on a product basis) than the aggregate program. However, there were no apparent access to claims issues with the state-run FFS program (as there were dispensations of every identifiable retail drug). At the same time, the CCO claims were associated with up to 24% less gross margin opportunity for our study pharmacies than the aggregate CCO program.
These findings reveal a significant degree of disparity in financial fortunes among providers, as the other Oregon retail pharmacies were potentially positioned for greater financial success for the delivery of pharmacy services in the state Medicaid program.
And while the aggregate numbers are demonstrative of the variability in claim access and reimbursement, perhaps nothing shows the difference in margin opportunity created through Oregon Medicaid CCO pharmacy services than our findings related to generic Tecfidera® (dimethyl fumarate).

As can be seen, just 745 claims for generic Tecfidera® produced $2.4 million in estimated margin above the drug’s acquisition cost for all of Oregon’s CCO pharmacy claims in 2021. In contrast, our study pharmacies during the same year made $1.5 million in estimated margin above drug acquisition cost for all the claims they dispensed under the Oregon Medicaid CCO program (n = 586,600 claims). This data demonstrates a significant gap between workload and financial success ($2.4 million in gross margin for 745 claims is more than 1,000-times greater value per transaction than $1.5 million in gross margin for 586,600 claims). Furthermore, it should be noted that despite having data for over 13.5% of all retail pharmacies in Oregon, our study pharmacies did not dispense a single claim of this financially lucrative dimethyl fumarate drug in the Medicaid CCO program in 2021.
This may speak to patient steerage or other efforts by CCOs/PBMs to capture disproportionate shares of select prescription claims. Across all analyzed claims, our study estimates savings of up to $40 million to the state if the aggregate observable payment for our study pharmacies was applied throughout the entire Medicaid CCO program.
While Medicaid is a unique program that enables us to make comparisons between our study pharmacies and the aggregate payer experience, the data from our study pharmacies can highlight payment disparities within how people obtain medications. The pharmacy market is broadly divided into three payer types: Medicaid, Medicare, and Commercial. Each of these segments is setting potentially different incentives for pharmacies. As our study pharmacies demonstrated, Oregon Medicaid reimbursements were associated with the lowest margin experience in our pharmacies, whereas Medicare was the most profitable. This is despite many of the medications used overlapping between the payers
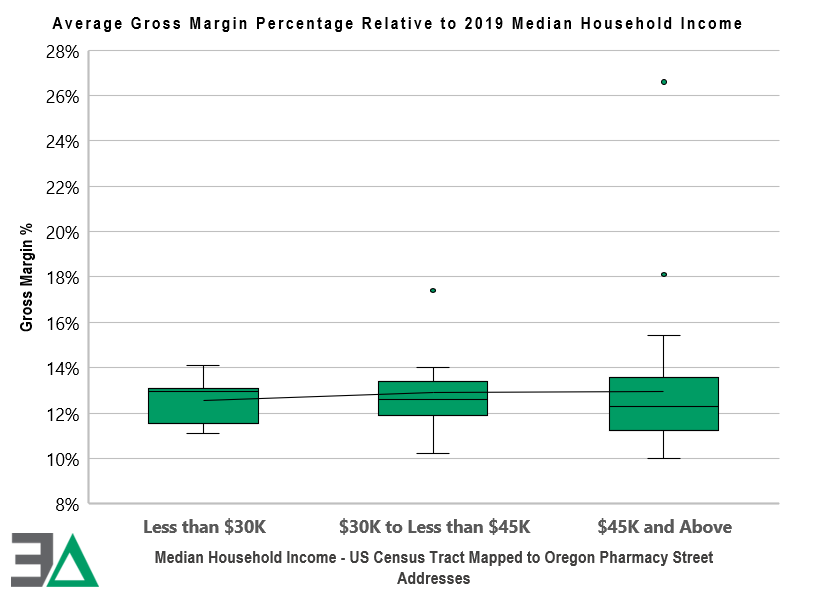
Overall profitability (as measured by gross margin above drug acquisition cost) at the pharmacy level was highly differentiated based upon whether the pharmacies were in high-income or low-income areas. As can be seen to the right, the higher the median income of the individuals in the geographic area of the pharmacy, the greater the average gross margin was likely to be – potentially demonstrating how pharmacies would be better served financially by investing in wealthier communities, and conversely, avoiding more impoverished areas of Oregon. Many pharmacies were seemingly rewarded for having lower average acquisition costs (via higher gross margins); however, the most profitable pharmacy had the highest average drug costs (the opposite of the assumed drug pricing policy goal of incentivizing utilization of low-cost drugs).
Our study also demonstrated the broad reimbursement challenges and opportunities facing Oregon pharmacies. The reimbursement trends are such that for every 100 prescriptions filled (based upon percentiles), the majority of claims (75 out of 100) dispensed at a typical retail Oregon pharmacy (as represented by those in our study) were insufficient to cover approximate pharmacy labor and drug costs. At the same time, a small number of claims (2 out of 100) were reimbursed extremely well – at times thousands of dollars above pharmacy labor and drug costs. The market incentives seemingly incentivize pharmacy businesses to seek out claims with high reimbursements (i.e., specialty), while trying to avoid the claims that are less financially lucrative or at worst, dispensed at a loss to the pharmacy. Said differently, the financial incentives appear to promote healthcare inequality, where financial rewards are distributed unevenly among pharmacy market participants and those pharmacies are encouraged to service some members above others.

The pressure to avoid losses can result in pharmacies setting very high cash prices (i.e., usual & customary [U&C] prices) to ensure maximum revenues are obtained from their primary customers, pharmacy benefit managers (PBMs) and insurers. If a pharmacy sets a low U&C, it risks missing the tail end of high reimbursements (figure on previous page). As the previous chart demonstrated, failure to capture the tail end of reimbursements can be financially devastating to pharmacy business operations.

Arguably, the disparity results in higher than reasonable pharmacy “sticker prices” that can have a disproportionate impact on patients in high deductible plans or those without insurance. Our report found vast differences in payment amounts for the cancer medication imatinib mesylate (generic Gleevec®), resulting in provider reimbursement (and by default, beneficiary cost sharing) that were over a 1,000% difference despite the prescription being reimbursed within the same plan by the same payer.
Ultimately, broad policy goals that may be intended to protect and enhance access to medicines and pharmacy services can be compromised when margin disparities can vary so widely from drug-to-drug and pharmacy-to-pharmacy. The data suggests that this inequity has a disproportionate negative impact on already disadvantaged communities. Further, the incentives embedded in the current system appear to reward and encourage higher drug prices at pharmacies, resulting in higher out-of-pocket costs for patients who obtain their medications through cost sharing or those without prescription drug coverage at all.
With this in mind, policymakers face real challenges in addressing reimbursement inequities given that the current paradigm results in many prescriptions being reimbursed below levels of provider sustainability (based upon Medicaid’s definition of actual acquisition cost plus a professional dispensing fee). While this report showcases a number of instances where incentives may be working against efficient spending on pharmaceuticals and equitable access to care, it is important to note that the findings suggest a more thorough examination of the drug marketplace as a whole is needed.
If you have questions about this report, please contact us at info@3axisadvisors.com.
Check out our one-pager on how Medicaid programs across the country were charged for generic Tecfidera by PBMs in their Medicaid managed care programs.
OTHER COVERAGE
The prescription drug cost issue has not gone away
The Bend Bulletin, 12/17/22
Pharmacists gather to report on problems with pharmacy benefit managers
Jefferson Public Radio, 11/1/22
Study: PBMs’ reimbursement puts pharmacies at risk
Formulary Watch, 11/1/22
New study: Inequity in pharmacy benefit managers’ drug pricing practices in Oregon raises serious questions
Business Wire, 10/27/22